How to Measure Product Updates and Launch Outcomes


The Importance Of Measuring Product Outcomes
Every product launch has a quantifiable impact. Even if the goal of the launch is something qualitative – like improving the design aesthetic of your product – the impact is quantifiable. A more aesthetically pleasing product will lead to more time spent in the product, for example. And you should measure that.
Immediately after a product launch is when you get the most important insights. This is when your users get their very first impressions of what you've built. It's also the time your product will most likely have fundamental UX issues, given that it has yet to be battle-tested by your entire user population.
This leads us to a central tenet of product management: You have to make sure that you can report on your product's outcomes, starting immediately after launch.
Event Tracking: The Key To Understanding Product Performance
Product insights are defined through data points referred to as "customer events." A customer event represents a timestamped user action in your product. The timestamp is crucial because user interactions are analyzed in the context of prior and subsequent actions.
Customer event data is used to develop the most common product outcome metrics focused on activation, engagement, and retention. Let's do a pair of quick examples to understand this better.
Measuring Signup Flow Performance
Take a standard signup flow consisting of two steps: a page where you input your username and password and a page that shows a successful account creation. You can measure the general performance of this signup flow using two simple events: "Signup Page Viewed" and "Account Created."
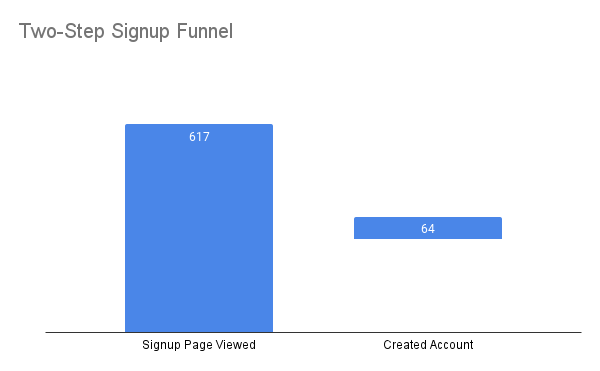
The ratio of "Account Created" to "Signup Page Viewed" gives you a conversion metric that indicates how well your signup flow is performing. The higher it is, the better.
So, if 64 users out of 617 that viewed the signup page create an account, you have a 10.3% conversion rate.
Measuring User Engagement With Your Product
Here's another example. Let's say you're building a meditation app. The central action taken by users of your product is to complete a single meditation session. The more meditation sessions a user completes, the more engaged they are.
To calculate your engagement metric, you need a single event: "Meditation Completed."
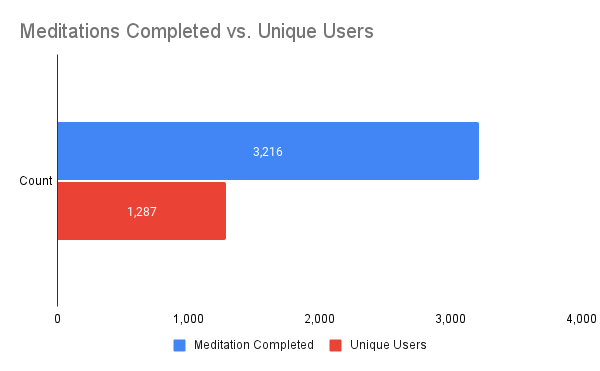
Divide the number of instances of "Meditation Completed" by the number of unique users with at least one "Meditation Completed," and you'll calculate your metric: the average number of meditation sessions completed by each user. Like the signup flow example, the higher this metric, the better.
3,216 meditations completed divided by 1,287 unique users equals 2.49 meditations per user.
Now that you know the importance of measuring product outcomes and how it ties to customer events, let's dig into how you can implement your plan.
Pre-Launch: KPIs and Data Capture
Before you launch your product, you have to decide on two things: your product performance metrics and the events you need to calculate those metrics.
Setting up KPIs and metrics is an extensive topic requiring several articles to cover fully. Let's start with a helpful summary: Begin with a question and work your way from that question to a metric. Then use that metric to make a list of needed events. Let's illustrate that with an example.
Let's say you're building a financial product and launching a feature where users can connect their bank accounts to your product. Since this process typically takes several steps, your question is, "How often do users start the integration flow but fail to complete it?"
The metric that answers this question is the "Conversion Rate Of The Account Integration Flow." The conversion rate is between 0 and 1, with higher values indicating a better success rate. Like the signup flow example we did earlier, you can measure this metric through two events: "Bank Account Integration Started" and "Bank Account Successfully Integrated."

So in this example:
- Question: How often do users start the integration flow but fail to complete it?"
- Metric: Conversion rate of the account integration flow
- Customer Events: Back Account Integration Started and Back Account Successfully Integrated
But a single user can connect multiple bank accounts, so another question is, "How often does a single user connect multiple bank accounts to our product?" The metric that answers this question is "Bank Accounts Connected Per User." Like our meditation app example, you can measure this metric through a single event: "Bank Account Successfully Integrated."
This process gave us our KPIs as well as our customer events. To learn more about developing good product metrics, check out my Product Analytics Course offered by Product Analytics Academy.
Post-Launch: Analysis and Monitoring
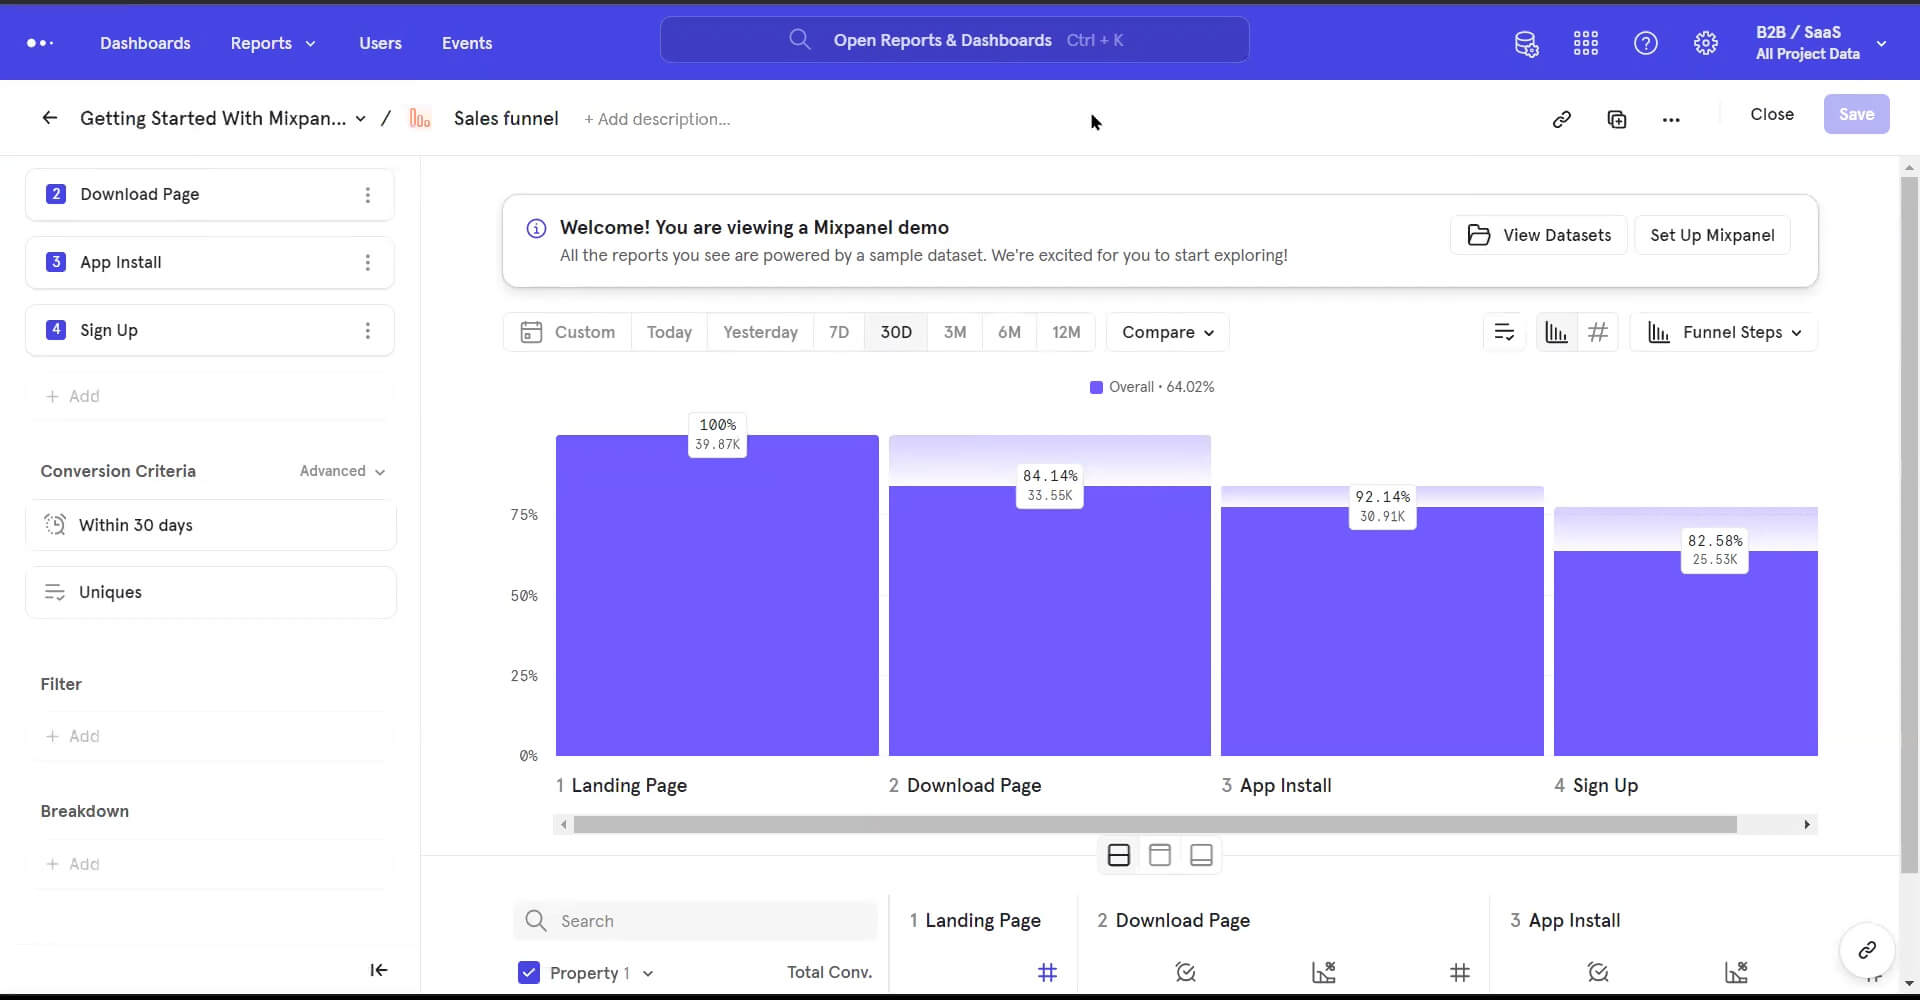
Once your product is launched, and data flows in, you can use a product analytics tool like Mixpanel or Amplitude to build reports that monitor the KPIs you decided on in your pre-launch process.
You should use a funnel report to measure a conversion rate metric. In the financial company example, your funnel will have the "Bank Account Integration Started" as its first step and "Bank Account Successfully Integrated" as its second step. The funnel report will then monitor the conversion rate between the events.
For engagement metrics, you want to use an Insights and Charts report, the most basic type of report available. Plot your total occurrences of the "Bank Account Successfully Integrated" event and the unique users who triggered the event, then divide the two by each other to get your engagement metrics.
Wrapping It Up
We've discussed why measuring product outcomes is essential immediately after launch. But more importantly, you know how to do pre-launch preparations and post-launch actions. The next step is to monitor the reports you built and iterate on them just like you iterate on your product.
About Ali Baghshomali
Ali is the founder of Mentat Analytics and Product Analytics Academy. Mentat Analytics is a data science and analytics consulting firm. Product Analytics Academy is an online school that teaches data skills to product managers. Before spinning up Mentat, Ali spent a decade working as a decade leader for companies like BuzzFeed and Bird.
.jpg)
.jpg)
.jpg)


.png)